| 2020 update: Given the ongoing Covid-19 situation and all the questions about whether we’ll see another KrisFlyer devaluation, I thought it’d be useful to revisit and update this post. I personally don’t believe we’re due for a devaluation just yet, not until 2022 at the earliest. The reason for this is simple: devaluations happen when there’s too many miles chasing too few seats. With experts predicting at least 3-4 years for air traffic to recover, it’s unlikely we’ll see full loads anytime soon. Furthermore, SIA has already secured S$15B of funding through its rights issue, which reduces the need to devalue in order to present a stronger balance sheet for capital raising. The sale of miles to banks and other partners will become an even more important source of revenue during this time. Devaluing KrisFlyer so soon after Covid-19 would reduce customer demand for miles, and endanger this revenue stream. New features like KrisFlyer Experiences and the expansion of KrisPay will also provide alternative outlets for burning on the ground, reducing the pressure on award seats. Of course, it’s just conjecture on my part. What do you guys think? |
A long time ago, airline miles used to be something that hardworking road warriors squirreled away for retirement to go see the world.
Sadly, that’s no longer feasible. In an age where companies are throwing miles at customers to do everything from buying flowers to taking out a mortgage, regular devaluations are part and parcel of the miles game.
I’ve said it before and I’ll say it again: miles are the absolute worst investment to hold. They don’t earn interest, they can only depreciate in value, and they’re not backed by any form of deposit insurance. We earn miles to burn, not to admire in our account.
2019 marked KrisFlyer’s 20th birthday, and it’s safe to say the miles and points landscape has changed dramatically since 1999.
| ❓ Did you know that before KrisFlyer, Singapore Airlines, Cathay and Malaysia Airlines operated a joint frequent flyer program called Passages? Read about that here! |
The last round of KrisFlyer devaluations got me thinking: how often does the program change? What features get added? What features get taken away? And can we predict future changes based on what we’ve seen in the past?
I started digging online for data, and after hours of playing around with the Wayback Machine and pawing through decades-old Flyertalk threads, I finally managed to put the following together- 15 years’ worth of Singapore Airlines award data, from 27 Oct 2003 to 24 Jan 2019.
The Big Picture
Here’s the story with KrisFlyer so far, if I plot a timeline of events from when it started till today:
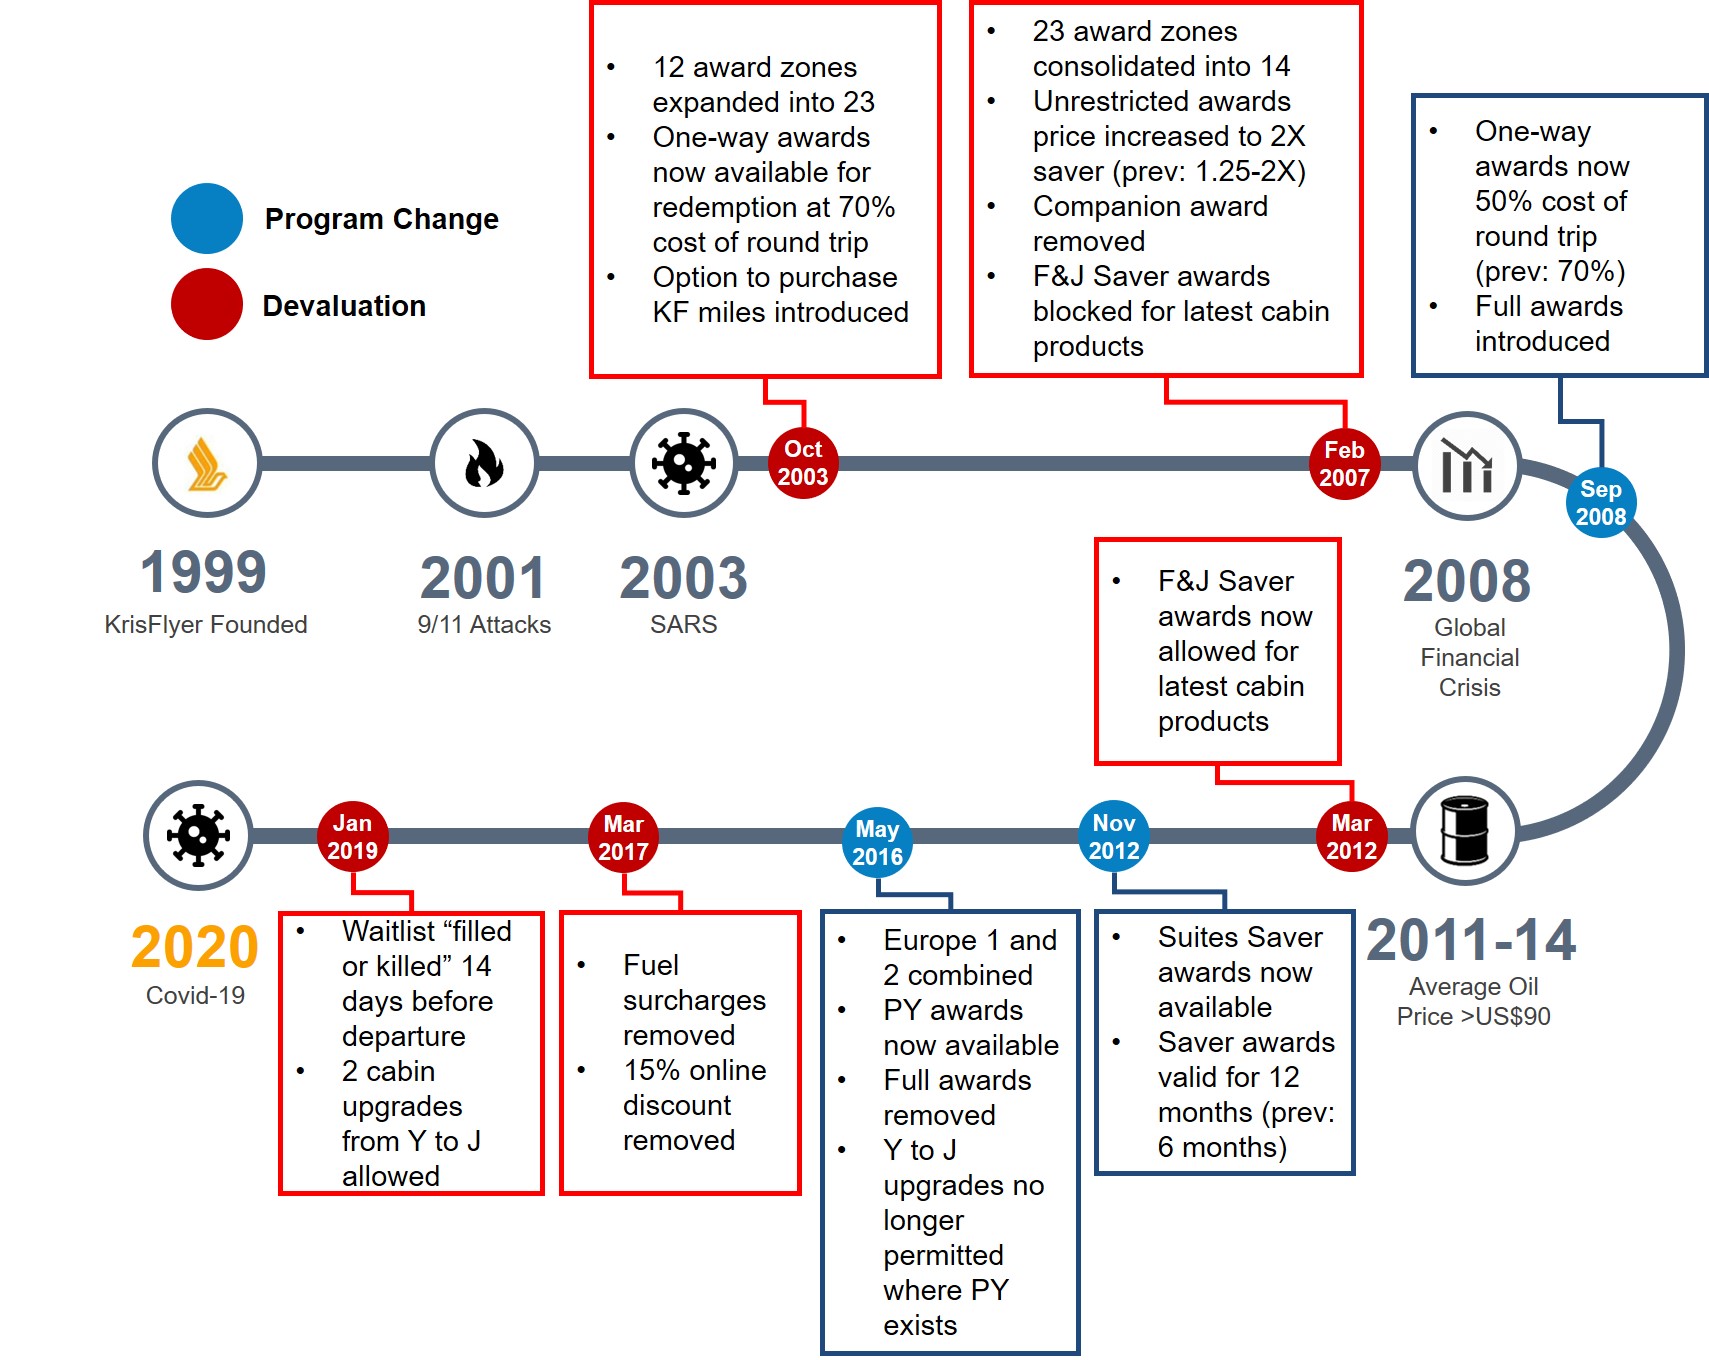
I’ve noted events that had a major impact on the air travel industry, such as 9/11, SARS and the Global Financial Crisis. It’s of course impossible to deduce causality here, e.g was SARS the cause of the devaluation we saw in October 2003, or was it just that the award chart was already four years old? Nonetheless, it makes for interesting viewing.
I’ve grouped events into two categories: devaluations and program changes. It’s of course debatable whether a program change can also be a de facto devaluation (e.g the May 2016 combination of Europe 1 and Europe 2 into a single zone led to an increase in award prices for certain European cities), but for argument’s sake let’s define a devaluation as an event where a majority of the award chart is affected.
The first thing you’ll notice about the timeline is the cadence of the red bubbles. Observe how they’re fairly evenly spaced between 2003 and 2007, 2007 and 2012, and 2012 and 2017? Historically speaking, devaluations happened every 4-5 years.
That’s why the small gap between the 2017 and 2019 devaluations came as such a surprise, and my working theory is that we’re now going to see more frequent, lower magnitude devaluations.
The second thing you’ll notice is the sense of symmetry. SIA initially does something unpopular, then reverses it a few years later to soften the blow of a devaluation. For example:
- In Feb 2007, KrisFlyer stopped allowing First and Business Saver awards to be redeemed on the latest cabin products on the B77Ws/A345s/A380s (what we know today as the 2006 Business and 2006 First Class)
- In Mar 2012, KrisFlyer devalued its charts, but allowed First and Business Saver awards to be redeemed for these products
And again:
- In Mar 2016, KrisFlyer stopped allowing Economy to Business Class upgrades on aircraft where Premium Economy was available
- In Jan 2019, KrisFlyer devalued its charts, but allowed two cabin upgrades from Economy to Business Class even where Premium Economy was available
You’ll also note some curious U-turns in policy. When KrisFlyer turned 12 award zones into 23 during the 2003 devaluation, it trumpeted the move as good for transparency and accuracy:
Our improved award charts will include more flight zones — 23 instead of the earlier 12. This will ensure that each region is more accurately represented — and make redemption travel much easier to understand and more transparent.
But barely four years later during the 2007 devaluation, 23 award zones went back to 14. The explanation this time?
To simplify the award charts, the number of zones will be reduced from the current 23 to 14.
Yes, I’m sure the change was at least partially due to customer feedback, but it does make for amusing reading in light of the 2003 spin. So… are we supposed to take it that redemptions are now harder to understand and less transparent?
How have prices changed?
Now let’s look at the award prices specifically. The chart below shows an overview of how the minimum and maximum Saver award costs have changed from 2003 till today.
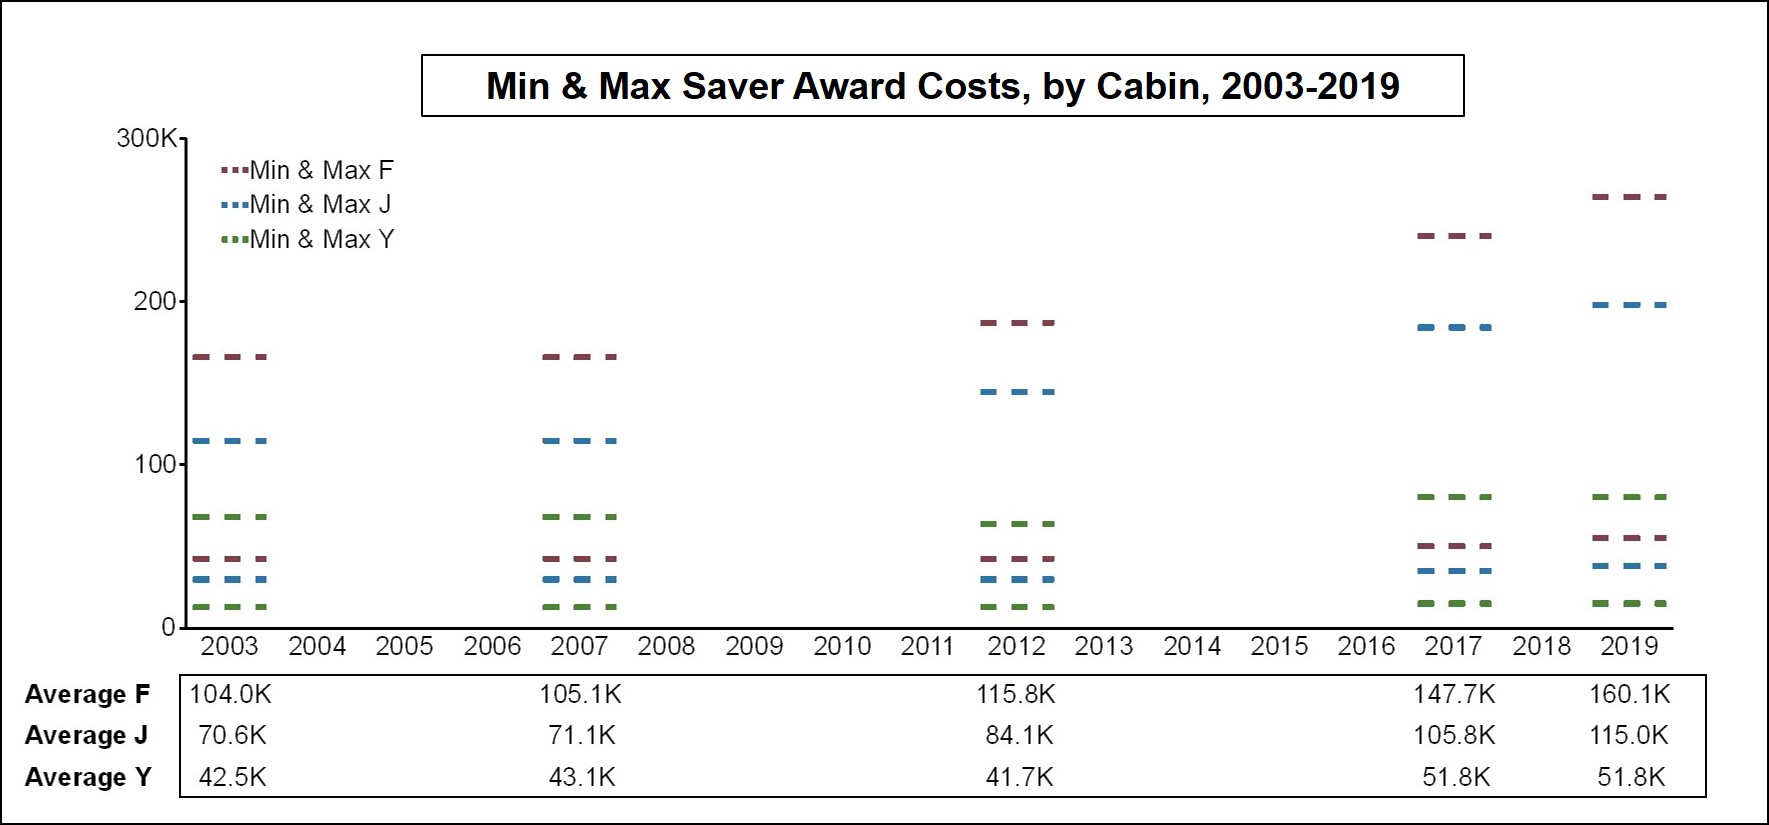
As you’d expect, there’s a general upward trend in pricing, but that trend is even more stark for Business and First Class awards.
The dashboard shows the average award pricing of an Economy, Business and First Class award after each of the devaluations, but that figure needs to be taken with a pinch of salt. The proper way to do this analysis would be to look at the split of SQ’s current destinations and work out the weighted average cost. That would be too time-consuming, so I’ve done a simple average across a basket of 15 different destinations. It may very well not be representative of the average price a KrisFlyer member may be paying, but it provides a quick and dirty indicator of how prices have creeped up.
| 💡 Methodology: I selected 15 cities from different zones based on the 2003 award chart. Jakarta, Bangkok, Hong Kong, Shanghai, Mumbai, Tokyo, Perth, Sydney, Jo’burg, Dubai, Amsterdam, Paris, London, San Francisco and New York. A simple average of the Y, J and F prices was taken |
A few more caveats to the above analysis:
- First, it’s not fair to do a straight miles to miles comparison between years because from 2017 onwards, fuel surcharges were removed from awards
- Second, this analysis speaks nothing to the number of seats released for Saver awards– that figure could well have increased or decreased in the intervening period, and I’m not able to account for that
- Third, this analysis doesn’t take into account opportunity cost. It’s fair to say that in 2003, it was significantly harder to earn miles than 2019- fewer miles cards and fewer third-party earning partnerships
I’m aware of these limitations, but if nothing else it still makes for interesting analysis. Just how much have award prices increased, and what’s driving the changes?
Economy Class award prices display more stability
| RT Prices | 2003 | 2007 | 2012 | 2017 | 2019 |
| Jakarta | 12.75 | 12.75 | 12.75 | 15 | 15 |
| Bangkok | 21.25 | 21.25 | 21.25 | 25 | 25 |
| Hong Kong | 25.5 | 25.5 | 25.5 | 30 | 30 |
| Shanghai | 34 | 34 | 34 | 40 | 40 |
| Mumbai | 34 | 34 | 31.45 | 37 | 37 |
| Tokyo | 34 | 38.25 | 38.25 | 50 | 50 |
| Perth | 34 | 34 | 34 | 40 | 40 |
| Sydney | 42.5 | 46.75 | 42.5 | 56 | 56 |
| Jo’burg | 51 | 46.75 | 42.5 | 50 | 50 |
| Dubai | 42.5 | 46.75 | 42.5 | 50 | 50 |
| Amsterdam | 59.5 | 59.5 | 59.5 | 76 | 76 |
| Paris | 59.5 | 59.5 | 59.5 | 76 | 76 |
| London | 59.5 | 59.5 | 59.5 | 76 | 76 |
| San Francisco | 59.5 | 59.5 | 59.5 | 76 | 76 |
| New York | 68 | 68 | 63.75 | 80 | 80 |
| Fuel Surcharges | No Fuel Surcharges |
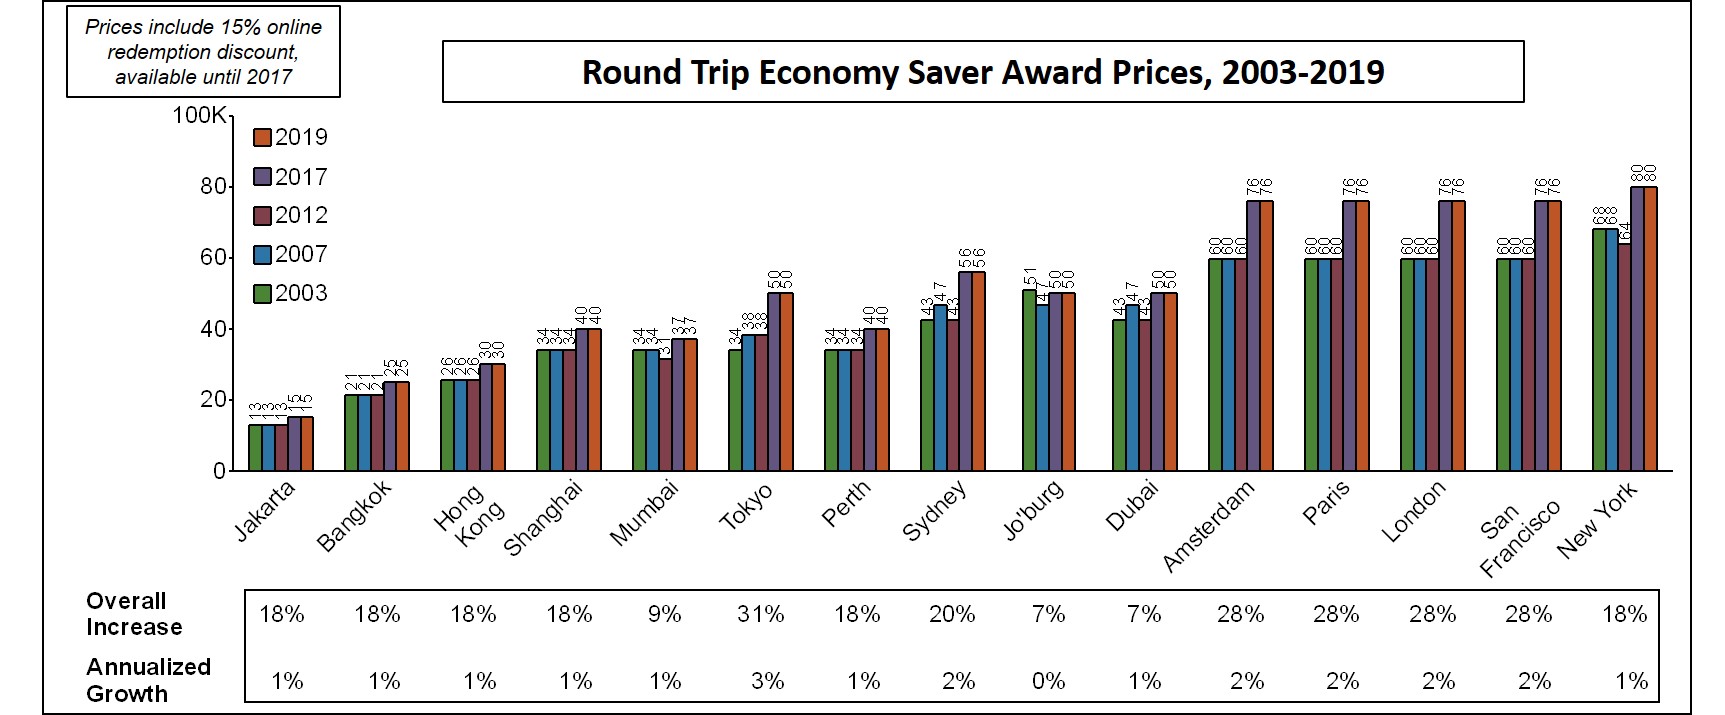
What’s pretty incredible is the slow rate at which Economy award prices have grown over the past 15 years.
With some limited exceptions, Economy award prices were virtually unchanged from 2003 to 2017, and actually declined for some destinations (eg SYD, DXB, JFK) during the 2007 and 2012 devaluations. There was a price jump in 2017 because the 15% online redemption discount was removed, but otherwise, prices have remained stable since.
Put it another way: in 2003, it cost 21,250 miles for a round-trip Bangkok Economy Saver award. In 2019, it costs 25,000 miles, and not because the list price had increased, but rather because the 15% online redemption discount was removed. You could even argue the “real” price has decreased because of the removal of fuel surcharges and the many ways of earning cheap miles that didn’t exist in 2003. How’s that for anti-inflationary pricing?
So if you’re the sort who’s been holding on to your miles for Economy tickets, you haven’t actually lost out all that much.
Long-haul Business Class award prices have risen dramatically since 2012
| RT Prices | 2003 | 2007 | 2012 | 2017 | 2019 |
| Jakarta | 29.75 | 29.75 | 29.75 | 35 | 38 |
| Bangkok | 34 | 34 | 34 | 40 | 43 |
| Hong Kong | 42.5 | 42.5 | 46.75 | 55 | 61 |
| Shanghai | 55.25 | 55.25 | 59.5 | 70 | 78 |
| Mumbai | 55.25 | 55.25 | 59.5 | 70 | 78 |
| Tokyo | 55.25 | 59.5 | 68 | 86 | 94 |
| Perth | 55.25 | 55.25 | 55.25 | 65 | 73 |
| Sydney | 72.25 | 76.5 | 93.5 | 116 | 124 |
| Jo’burg | 85 | 76.5 | 76.5 | 90 | 98 |
| Dubai | 68 | 76.5 | 76.5 | 90 | 98 |
| Amsterdam | 93.5 | 93.5 | 102 | 170 | 184 |
| Paris | 93.5 | 93.5 | 136 | 170 | 184 |
| London | 102 | 102 | 136 | 170 | 184 |
| San Francisco | 102 | 102 | 136 | 176 | 190 |
| New York | 114.75 | 114.75 | 144.5 | 184 | 198 |
| Fuel Surcharges | No Fuel Surcharges |
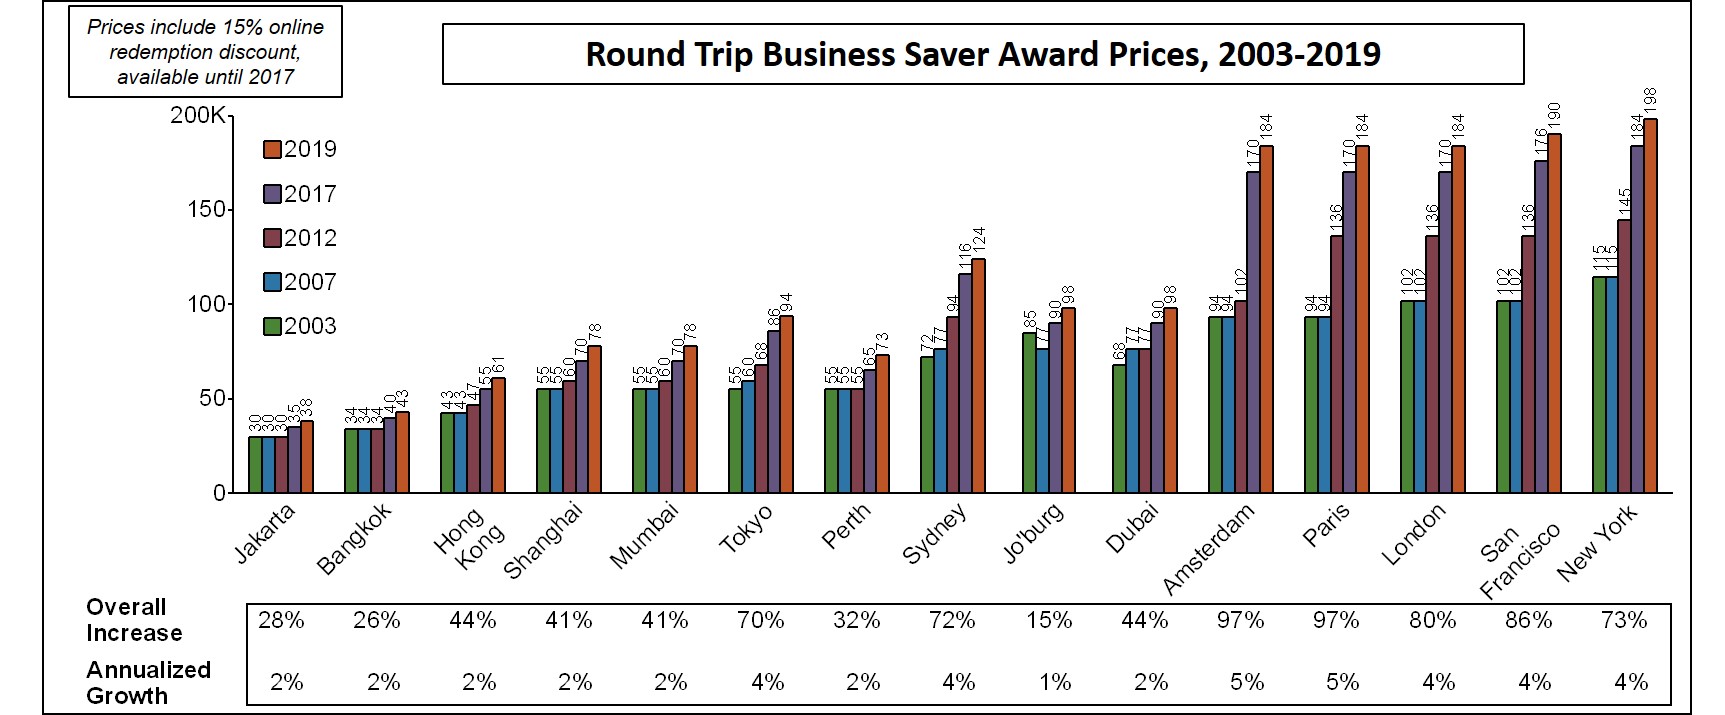
It’s a much different story when we talk about premium cabin awards, especially those for long-haul travel.
Award prices for some destinations (Europe, West Coast USA) have almost doubled in the period of our analysis, with large jumps during the 2012 and 2017 devaluations. In 2012, Business Class awards to Europe and the USA increased dramatically (London +33%, Paris + 45%, San Francisco +33%), and then there was the 2017 double whammy where award prices rose and the 15% online redemption discount was removed (London +25%, Paris +25%, San Francisco +29%).
If your miles goal is long-haul premium cabin travel (and it should be), this chart explains exactly why earning and burning is the order of the day- not only do your miles lose 4-5% of their value each year, but the most recent rounds of devaluation have hit premium cabins disproportionately hard.
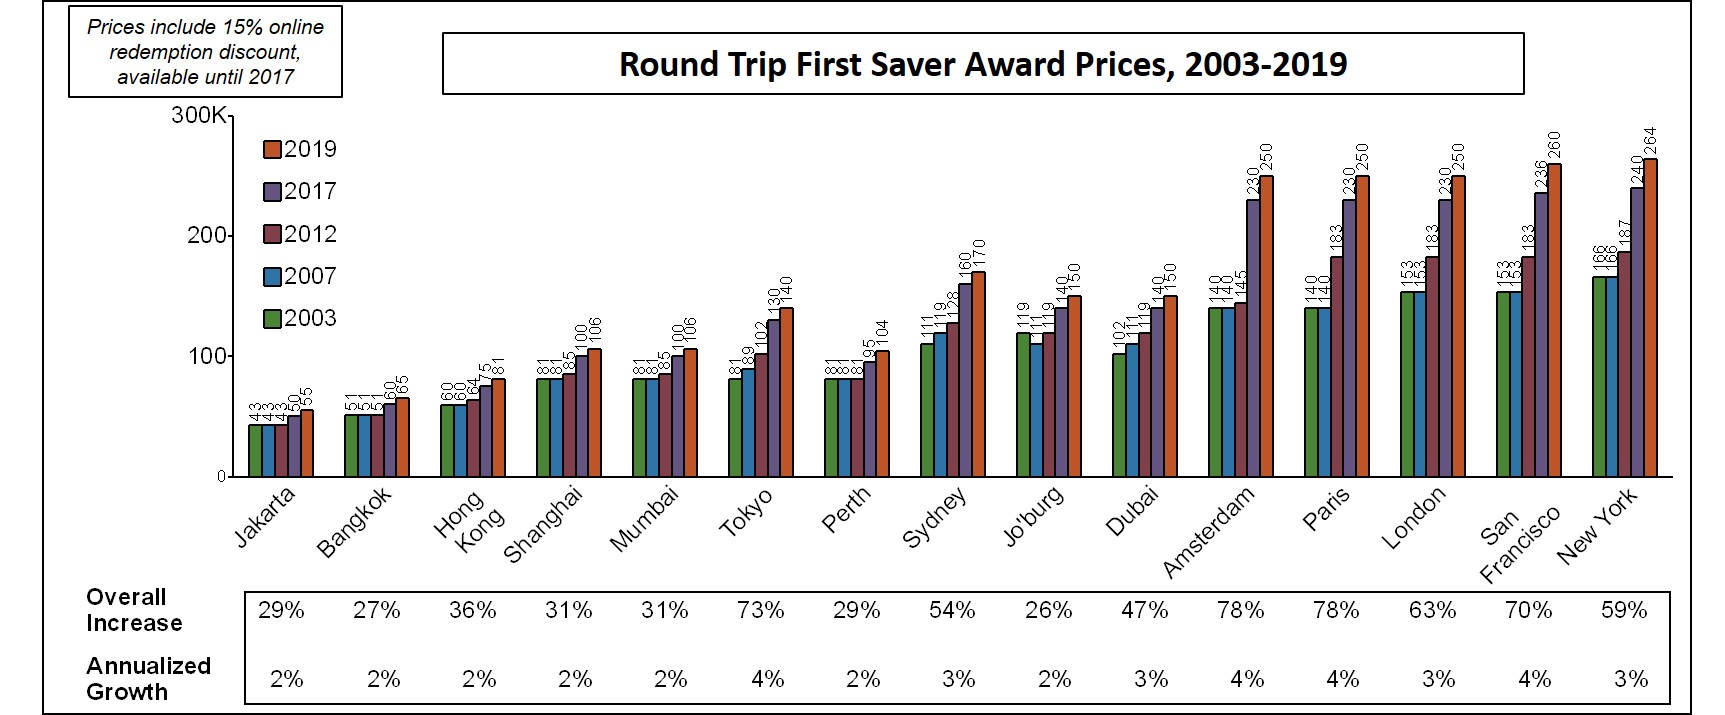
Long haul First Class awards have also risen, but not as fast as Business Class
| RT Prices | 2003 | 2007 | 2012 | 2017 | 2019 |
| Jakarta | 42.5 | 42.5 | 42.5 | 50 | 55 |
| Bangkok | 51 | 51 | 51 | 60 | 65 |
| Hong Kong | 59.5 | 59.5 | 63.75 | 75 | 81 |
| Shanghai | 80.75 | 80.75 | 85 | 100 | 106 |
| Mumbai | 80.75 | 80.75 | 85 | 100 | 106 |
| Tokyo | 80.75 | 89.25 | 102 | 130 | 140 |
| Perth | 80.75 | 80.75 | 80.75 | 95 | 104 |
| Sydney | 110.5 | 119 | 127.5 | 160 | 170 |
| Jo’burg | 119 | 110.5 | 119 | 140 | 150 |
| Dubai | 102 | 110.5 | 119 | 140 | 150 |
| Amsterdam | 140.25 | 140.25 | 144.5 | 230 | 250 |
| Paris | 140.25 | 140.25 | 182.75 | 230 | 250 |
| London | 153 | 153 | 182.75 | 230 | 250 |
| San Francisco | 153 | 153 | 182.75 | 236 | 260 |
| New York | 165.75 | 165.75 | 187 | 240 | 264 |
| Fuel Surcharges | No Fuel Surcharges |
Although First Class award prices have not grown as quickly as Business Class, it’s still a similar story.
Award prices were fairly stagnant from 2003 to 2012, with the main changes coming because of zone reclassifications. But in 2012, prices started escalating for long-haul awards (Paris +30%, London+19%, New York +13%), and in 2017 First Class prices went up by as much as 30%. 2019’s devaluation was relatively more mild (6-10%), but the end result is that round-trip First Class awards are slowly pushing the 300K mark.
To be fair, we have seen improvements in the qualitative aspects of First Class awards during this period:
- Suite Saver awards were finally made available in late 2012, which allowed KrisFlyer members to redeem SQ’s most luxurious product at reasonable rates
- SQ’s new 2017 Suites were made available for redemption immediately after launch (it’s very hard to get instantly confirmable Saver space, however)
- Although SQ has downsized its First Class cabins on the B77W (8 to 4) and A380s (12 to 6), the airline continues to invest in its First Class product and we will be seeing new cabin products on the 777-9 jets which arrive in 2021-2022
What can we expect for prices going forward?
Unless the spigot of cheap miles flooding the market is somehow switched off (which I doubt), I think it’s inevitable that we’ll see more frequent devaluations in the future, perhaps at a 2-3 year cadence.
My constant fear is that we’ll start seeing revenue or demand-based pricing, which would destroy so much of the value in the KrisFlyer program. It’s started happening in the US, we’re seeing that with some carriers in Europe (e.g FlyingBlue) and closer to home (e.g Malaysia Airlines Enrich), and although there’s no hard evidence to suggest it’s coming here, I think it’s the kind of thing to which you can never say never.
Come to think of it, Spontaneous Escape awards are a form of demand-based pricing, just in reverse. When demand on certain routes is weak, SQ offers discounted award tickets in the hope of monetizing some of the empty seats. It wouldn’t be difficult to flip that argument around and raise the prices on certain routes during peak period, although I suppose the counter to that is we already have Advantage awards, which are intended for such cases.
I know I give sub-optimal ways of cashing out miles like KrisPay and KrisFlyer vRooms a hard time, but in the cold light of day they actually serve as a means of keeping the economics of the program balanced. I wouldn’t use them, and I wouldn’t advise anyone to either, but to the extent that they keep award prices from appreciating too fast, we should perhaps be thankful they exist.
Random interesting tidbits
While going through all this past data, I came across some trivia that I thought I’d share too.
The price of buying miles from SIA hasn’t changed in 15 years
Here’s a screengrab from an ancient version of the SIA website. Does that text in red look familiar?
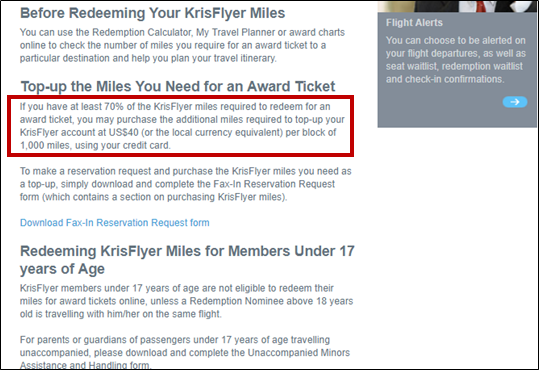
As it turns out, SIA introduced the option to buy additional KrisFlyer miles way back in October 2003. The price then? US$40 per 1,000 miles, same as the price today.
Sure, you could argue that US$40 now (S$55) is less than US$40 then (S$70 at Oct 03 rates), but it’s kind of interesting that the USD-denominated price has remained stagnant at a time when cheap miles are flooding the market. Paying US$40 for 1,000 miles may have been reasonable in 2003, but now? It’s way too high.
(No, I’m not ignoring inflation. I just don’t think that the price of miles should rise over time- quite the opposite, it should fall)
SIA once upon a time offered companion awards
For the uninitiated, companion awards are discounted awards that can redeemed for a traveling partner, so long as one of you holds a revenue ticket. The idea was to allow trailing spouses to tag along on company trips- the company would pick up the tab for the employee, and the employee would use his or her miles to cover the spouse.
These were only available on Business and First Class revenue fares, but the redemption rates were hard to argue with. 100K miles for round trip Business to LHR or SFO, 160K miles for round trip First to JFK…if someone else was picking up the tab for the revenue ticket, why not?
Sadly, these were phased out in 2007.
Half-priced one-way awards are not a God-given right
One of the great things about award tickets is that a one-way award usually costs 50% of a round-trip price. That’s a blessing, because one-way revenue tickets tend to be disproportionately expensive.
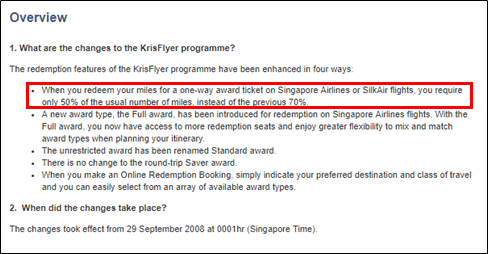
And yet, this isn’t the case for all programs. Asia Miles, for instance, continued to charge one-way awards at 55-75% of round-trip prices all the way until 2018. KrisFlyer has been doing 50% one-way awards for a very long time, but it hasn’t always been their policy. Before 2008, one-way awards cost 70% of round-trip awards. Before 2003, they weren’t even allowed!
So the next time you save big on a one-way ticket by redeeming your miles, remember that you have it better than KrisFlyer laojiaos.
It’s amazing that the 15% online redemption discount lasted as long as it did
It’s hard to remember a time when booking an award involved getting on the phone or heading down to a physical ticketing centre (that said, KrisFlyer didn’t let you redeem partner awards online all the way till December 2017, and even that was a right mess at first), but back in the early 2000s that was very much the case.
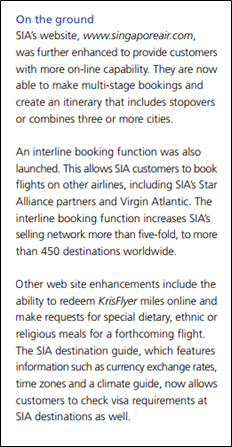
In 2003, SIA improved its website’s capabilities, chief of which was the ability to redeem KrisFlyer miles online. To mark the occasion the airline offered 25% off round-trip redemptions in June 2003, which was later scaled back to 15% from July 2003 onwards.

That discount improbably continued all the way until March 2017, when it was finally removed. That’s almost 14 years of discounting, even after internet penetration became widespread.
In theory, the 15% discount was only supposed to be for online redemptions, but because of the shortcomings of the SQ website (inability to do mixed cabin awards, inability to add a stopover of more than 30 days, inability to waitlist for upgrades), the discount also ended up being offered on many phone bookings. Eventually, it became seen as an entitlement, and that’s probably when SIA decided it’d run its course.
I loved the 15% discount and was sad to see it go, but I always sort of thought that SQ worked that into their pricing anyway, giving the illusion of a discount where none really existed. All things considered, I’m surprised it lasted as long as it did.
Conclusion
Digging through old data and circulars really got me feeling nostalgic, and I only wish I had the award charts from before 2003 because I suspect that those would be the ones in effect during the 1999-2003 period after Passages became KrisFlyer.
| ❓ Did you know that from 1994 to 2006, Singapore Airlines ran a frequent flyer program just for kids? Read about the KrisFlyer Young Explorers Club here! |
I hope this serves as a useful guide for those interested in KrisFlyer history. Perhaps in the future I’ll look into historical Star Alliance pricing, but for now, that’s the history of SQ/MI devaluations.


Great read on a May Day holiday!
I enjoyed the deep research tremendously! Do keep it up!
You can be a historian now 😂
pardon a noob here, but “Half-priced one-way awards are not a God-given right”
After reading this, you mean to say that even now, KrisFlyer is throwing in a 50% discount for one-way redemptions? I haven’t seem to come across this
One way is 50% of round trip price
Thanks for the efforts Aaron. Great read and a more positive story than i expected
👍🏻👍🏻👏🏻👏🏻😊😊
One of the reasons I moved most of my non flying miles to Asia Miles. CX is just way more generous and they even allow lounge access for MPC Silver.
CX was great with no yq ex hkg… but I think that’s changed. At least they now do 50% Ow awards
this was such a fantastic read and a hard-hitting analysis… keep up the great work for all of us miles enthusiasts
Glad you found it useful!
Nice article, Aaron. Would you have an idea what revenue costs for these tickets were in 2003? Dad having some old receipts lying around somewhere?
Nah, although maybe Skyscanner might have that data
Did you try asking your dad for his old receipts from 2003, Lifshitz?
Wonderful post and thanks!
Thank you and great effort!! It provided a better picture of the miles values & program.
[…] 15 years of Singapore Airlines KrisFlyer devaluations […]
Aaron, could you publish the full dataset that you put together for this article? I’d like to run it against macroeconomic variables (oil prices, GDP, mile earn rates) to see how they respond to each other
don’t forget hemlines!
the full data is available in the google sheet. cells are colored based on inputs. 1= economy, 2= business, 4= premium economy
Thanks Aaron. Your articles are always very insightful and I have learned a lot. Have you ever compared between the different frequent flyer programs in terms of costs for redemption tickets? Credit cards like Citi Prestige allow more flexibility in terms of mileage redemption to different flyer programs and would be great to learn which is the most advantageous program. Thanks and keep up the great work!
thank you! it’s great to hear you find it useful.
i have, in bits and places, written about the value of some of these alternative frequent flyer programs. eg turkish airlines, etihad, avios.
we bring all this together in a class called “alternate FFPs”- watch on the site for when it next runs!
Great article many thanks for putting it together. As someone who primarily redeems for SEA business I didn’t realise how little this has increased in the past 17 years!
FYI there is a small error in the flow chart 2012 and 2016 are the wrong way round.
excellent spot, have fixed that. thank you!
Hi Aaron, just some anecdotal info. Even though companion award discounts are long gone, whenever I’m travelling on a revenue ticket (paid by the client) I’ve found it very easy to get a saver award waitlist cleared on the same flight for my partner by calling in, even on high demand routes like SIN-LHR-SIN. Usually clears within the same day. Not as great as before, but better than nothing. I’ve since dropped from QPPS to KFEG though, and haven’t tried it since the status downgrade, so I’m not sure whether that matters.
Yes- I’ve heard such stories too. Apparently your odds of clearing the waitlist improve if you have a revenue ticket purchased on the same flight. I’m sure your QPPS status helped too though, and there’s ultimately no way of knowing for sure what was the decisive factor