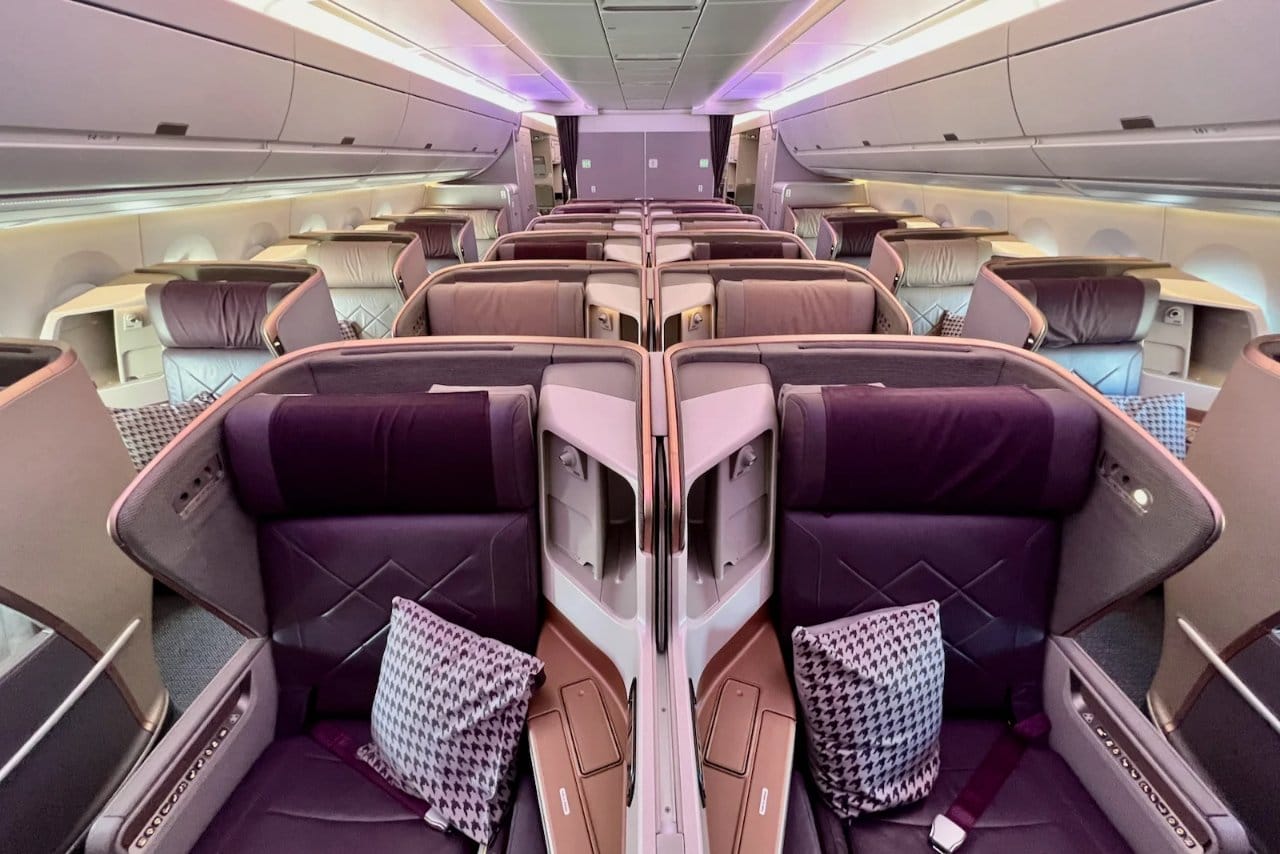
KrisFlyer Spontaneous Escapes (SE) is one of Singapore Airlines’ most popular promotions, with 30% off redemptions for selected flights in Business, Premium Economy and Economy Class each month.
This can really help to stretch your miles, and many people camp on the SIA website during release day (15th of each month, or the next working day), waiting for inventory to be loaded.
 |
| Spontaneous Escapes |
One of the most common questions I get asked is “will [insert destination here] feature for this month’s SE?” And the honest answer is: no one knows except SIA.
SEs are a way of filling up seats that would otherwise have gone out empty, which is why you only get one month’s notice (about the time when the revenue management team is fairly confident about expected flight loads). Unless you have access to that data, there’s no way to know for sure.
That said, we can make educated guesses about what’s likely to appear, given what we’ve seen in the past. And that’s now a lot easier thanks to the KrisFlyer Spontaneous Escapes Analysis Tool (SEAT), the creation of an intrepid MileLion reader.
How KrisFlyer SEAT came about
 |
| KrisFlyer SEAT |
| Buy the creator a coffee! |
Back in July 2019, I wrote an article called “Analyzing 20 months of KrisFlyer Spontaneous Escapes: Which destinations are likely to feature?”
Clunky Awesome title aside, this looked at 20 months’ worth of SE data to see:
- When SE are typically released (irrelevant, now that SIA has fixed its release cycle on the 15th of each month, or the next working day)
- The overall mix between Business and Economy Class SE awards, and how that varies by month
- Which destinations appeared the most frequently for SE
- Which destinations appeared the least frequently for SE
- How the size of SE varies by month
I was dragging my feet about updating the analysis, until a few months ago a reader named Ruibin reached out and showed me something he’d compiled from past MileLion articles: an SE data set stretching back to November 2017 (Spontaneous Escapes only became a permanent feature from February 2019, but had been running for many months before that).
SEAT currently features 53 months of SE, a number that will continue to grow as new editions get automatically added.
A few points to note:
- Not every month had a SE, most notably April 2020 to March 2022 when COVID was at its worst
- The months here represent the travel period, e.g. May 2023 refers to SEs for travel in May 2023 (which were announced in April 2023). In most cases, SEs are only valid for travel the following month, but there are some editions where travel can take place over the next two months. These are reflected accordingly in the data
- SilkAir was merged into SIA in 2021, and its routes transferred to SIA and Scoot. SEAT’s data set features both SilkAir and SIA SEs
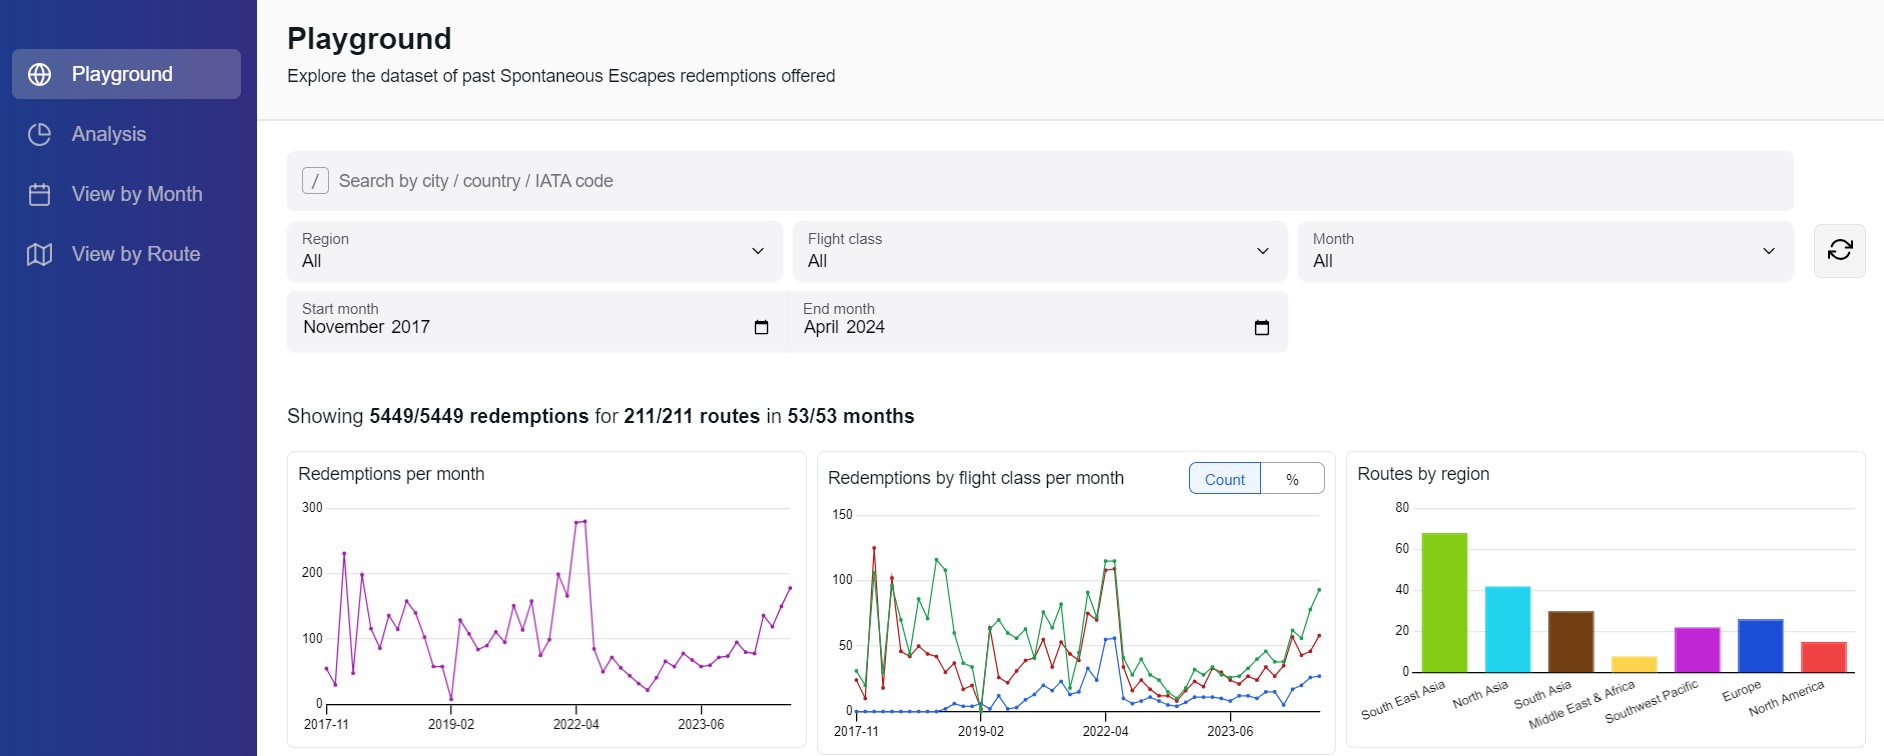
SEAT is a lot of fun to play with, especially if you’re a data nerd, so I invite you to experiment with the Playground tab where you can cut data by:
- City
- Country
- Region
- Flight Class
- Month
- Period
Here’s what I think are some interesting insights.
Which months offer the most SEs?
| ✈️ Spontaneous Escapes: Avg No. of Awards Per Month | ||||
| Month | Y | PY | J | Overall |
| Apr | 76 | 18 | 62 | 156 |
| May | 68 | 17 | 52 | 137 |
| Jan | 53 | 9 | 51 | 113 |
| Mar | 54 | 13 | 43 | 110 |
| Sep | 65 | 10 | 35 | 110 |
| Oct | 61 | 10 | 28 | 98 |
| Feb | 45 | 17 | 36 | 98 |
| Jul | 51 | 7 | 32 | 89 |
| Aug | 46 | 8 | 34 | 89 |
| Nov | 45 | 10 | 31 | 86 |
| Jun | 42 | 5 | 33 | 80 |
| Dec | 25 | 5 | 23 | 53 |
If you’re hoping to snag an SE award, your best bet is to look at travel in April, May and January. These three months, on average, had the most number of routes available for redemption.
Not surprisingly, June and December, two of the most popular months for travel for Singaporeans, feature at the bottom. With load factors peaking in these months, regular award seats, let alone SEs, are few and far between.
How does seasonality affect SEs?
| Region | Best 3 months | Worst 3 months |
| Southeast Asia | 1. April 2. September 3. January |
1. December 2. July 3. February |
| North Asia | 1. January 2. April 3. May |
1. June 2. December 3. November |
| South Asia | 1. April 2. September 3. July |
1. December 2. February 3. November |
| Middle East & North Africa | 1. June 2. May 3. February |
1. December 2. November 3. October |
| Southwest Pacific | 1. March 2. May 3. April |
1. December 2. January 3. September |
| Europe | 1. May 2. April 3. March |
1. August 2. June 3. September |
| North America | 1. May 2. February 3. April |
1. July 2. August 3. June |
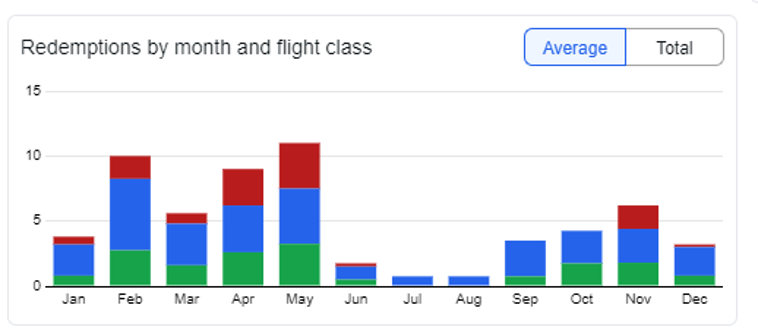
We know travel demand is seasonal, so an interesting cross cut we can look at is regions by month. Should you expect to spend winter in Europe, or spring in Australia?
Well, what jumps out the most is that the two regions with the biggest variability by season are Europe and North America.
The data shows you can forget about travelling to Europe in summer. June to September is usually a virtual drought for Europe SEs, with availability improving steadily from January up till May.
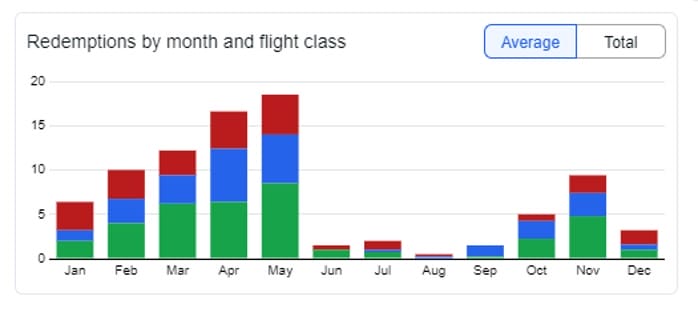
A similar pattern can be seen for North America, where June to August is the dry season, and February to May a more fertile period.
Which destinations are most likely to feature for SE?
| ✈️ Most Featured | ✈️ Least Featured* |
|
|
| *Only considering destinations currently served by SIA. I’ve excluded Brussels since the route only launches in April 2024 | |
If you love the street food of Ho Chi Minh City, the cultural heritage of Ahmedabad, or the, um, traffic of Dhaka, then good news: you’re virtually guaranteed to see these destinations for SE. Other SE staples include Chennai, Bangalore, Kuala Lumpur and Manila.
On the other hand, those hoping to visit Manchester, Seattle and Copenhagen will be sorely disappointed, and you can count on one hand the number of times several European destinations have featured over 50+ editions of SE.
Which destinations are most likely to have Business Class SEs?
| ✈️ Most Featured in Business Class |
|
SEs are a great opportunity for you to have your first-ever Business Class experience, and if how you get there is more important than where you go, then the most common Business Class SEs are for Ahmedabad, Chennai and Dhaka.
If you’d prefer to stick to Southeast Asia, then Ho Chi Minh, Manila or Kuala Lumpur would be your best bets (though the last flight is so short you won’t have much to enjoy in the air!).
Which months does Japan feature the most?
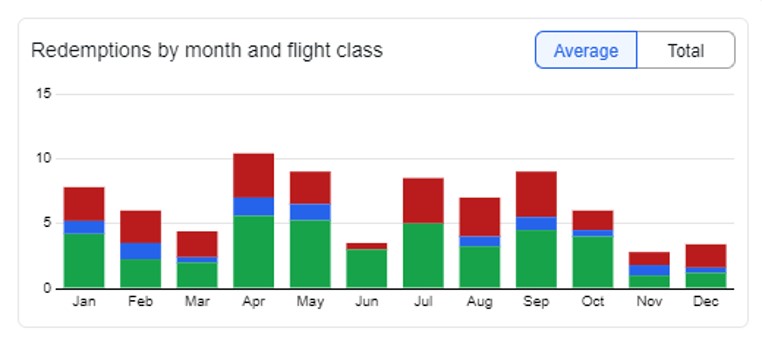
Given Singaporeans’ love for all things Japanese, it’s no wonder that one of the first things most people check is whether any Japan destinations are available on this month’s SEs.
Well, the data shows, somewhat surprisingly, that April’s Sakura season is actually when we usually get the most Japan SE destinations, with May July and September also good bets. But forget about taking the kids, because the entire school holiday period of March, June, November and December is slim pickings for Japan.
Have Spontaneous Escapes become less generous?
With Singapore Airlines’ load factors recovering to or even beating pre-COVID highs, there’s fewer and fewer empty seats on each flight. That has a corresponding effect on award seats, and by extension SEs.
That’s the theory at least, but is it borne out by the data?
There’s a few ways we could approach this. The simplest would be to count the number of routes offered for each edition of SE, but that wouldn’t be fair because SIA’s route network has evolved over time. For instance, pre-COVID SEs would be inflated because they featured SilkAir routes, some of which were retained by SIA, others were shipped off to Scoot.
Moreover, the number of flights operated by SIA changes each month as new aircraft arrive and existing aircraft enter maintenance, which would in turn affect the number of seats available.
So a better approach would be to express the number of SE routes as a percentage of SIA’s total route network for that month. Obviously, this may not be a perfect proxy because more routes doesn’t necessarily mean more seats (not to mention blackout dates will vary from month to month), but without knowing the exact number of seats released each month, it’s as good as we can hope for. Special thanks goes to Mayur Patel, Head of Asia at OAG for providing the data for this analysis.
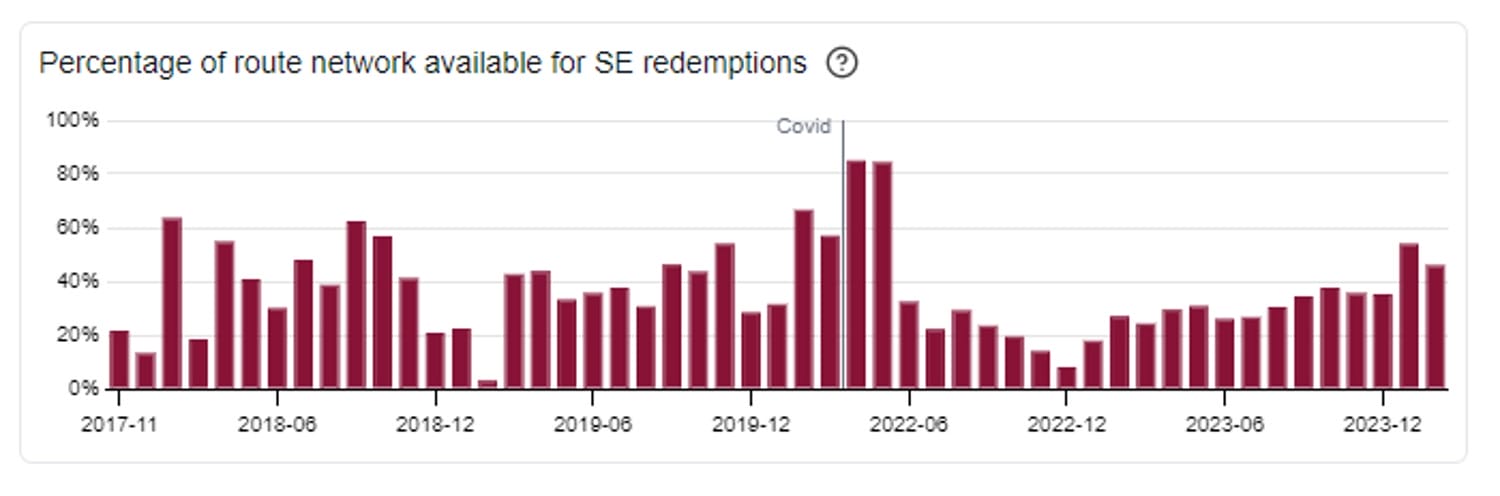
When we compare the pre and post COVID figures, we can see there’s a discernible difference in the percentage of route network offered up for SE redemption; prior to COVID the median was 40%, post COVID it’s become 30%.
With the exception of April and May 2022, when Spontaneous Escapes returned after a two-year hiatus and SIA marked the occasion by putting most of its route network up for redemption, we’re generally seeing a lower percentage of the network offered on SE post-COVID, which supports the idea that SEs are now less generous.
But it’s far from conclusive, because COVID skews everything. When Singapore first reopened its borders, there was a wave of revenge travel like nothing we’d seen before. This, coupled with supply lags caused by cabin crew, pilot and aircraft shortages, meant that SIA couldn’t scale up its flights as quickly as it would have liked.
Now that things have normalised a bit, it’ll be interesting to see how SE supply evolves over the next 12 months, and the recent editions of SE have been notably bigger (though it could just be the fact we’re heading into the historical April/May SE supply peak).
Conclusion
The KrisFlyer Spontaneous Escapes Analysis Tool is an easy way of digesting months of SE data, identifying patterns and making educated guesses about future editions.
Obviously, no one knows with absolute certainty what will feature but Singapore Airlines, but this is about as close as we can get as outsiders.
Thanks again to Ruibin for putting together this fantastic tool, and if you’ve found it useful do send some coffee money his way!
What other interesting insights can you find in the data?
I’ll be the first to say it, thank you Aaron
thank to ruibin for this! i just provided some feedback here and there
this is the data analysis we come to expect and apprecite from you Aaron. you are the hero we Singaporeans do not deserve.
credit to ruibin for all the hard work! he had to clean up a lot of data to get it into this easy form we can now enjoy.
So….isn’t there a publicly available proxy for this?
*cough* GDS. Though I’m not sure there’s GDS history by fare bucket.
Well done Ruibin! Now we need predictive analytics for the perennial question: “Will my waitlisted flight for destination X be confirmed, if so by when…”